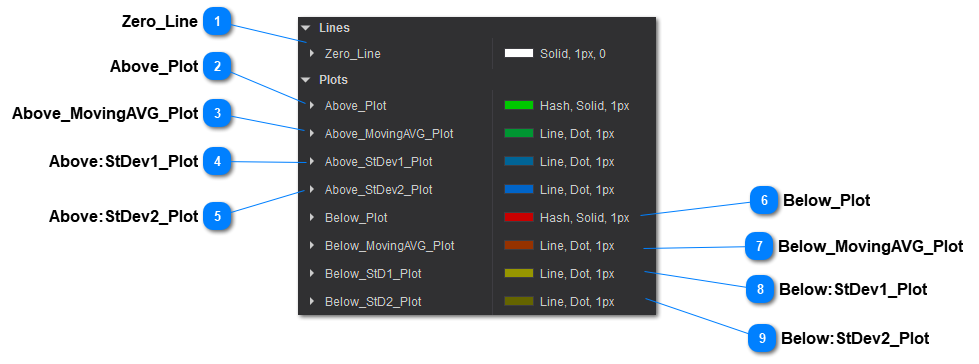
Sets the style for the zero line. Will color bars that have exactly zero value.
Above_Plot
Set the style for the values between zero and the moving average and its bar color. Will also display the value of the bar.
Above_MovingAVG_Plot
Set the style for the moving average above zero and its bar color.
Above:StDev1_Plot
Set the style for the 1nd Standard Deviation above zero and its bar color.
Above:StDev2_Plot
Set the style for the 2nd Standard Deviation above zero and its bar color.
Below_Plot
Set the style for the values between zero and the moving average and its bar color when the plot is below zero. Will also display the value of the bar.
Below_MovingAVG_Plot
Set the style for the moving average below zero and its bar color.
Below:StDev1_Plot
Set the style for the 1nd Standard Deviation below zero and its bar color.
Below:StDev2_Plot
Set the style for the 2nd Standard Deviation below zero and its bar color.