Limit Order Visualizer Calculation Modes
We created three types of Calculation Modes:
Manual Mode
– Allows you input a value that will determine the maximum that you are expected to see.Example of Manual Mode with Max Manual Volume set to 200 using the Heatmap mode.
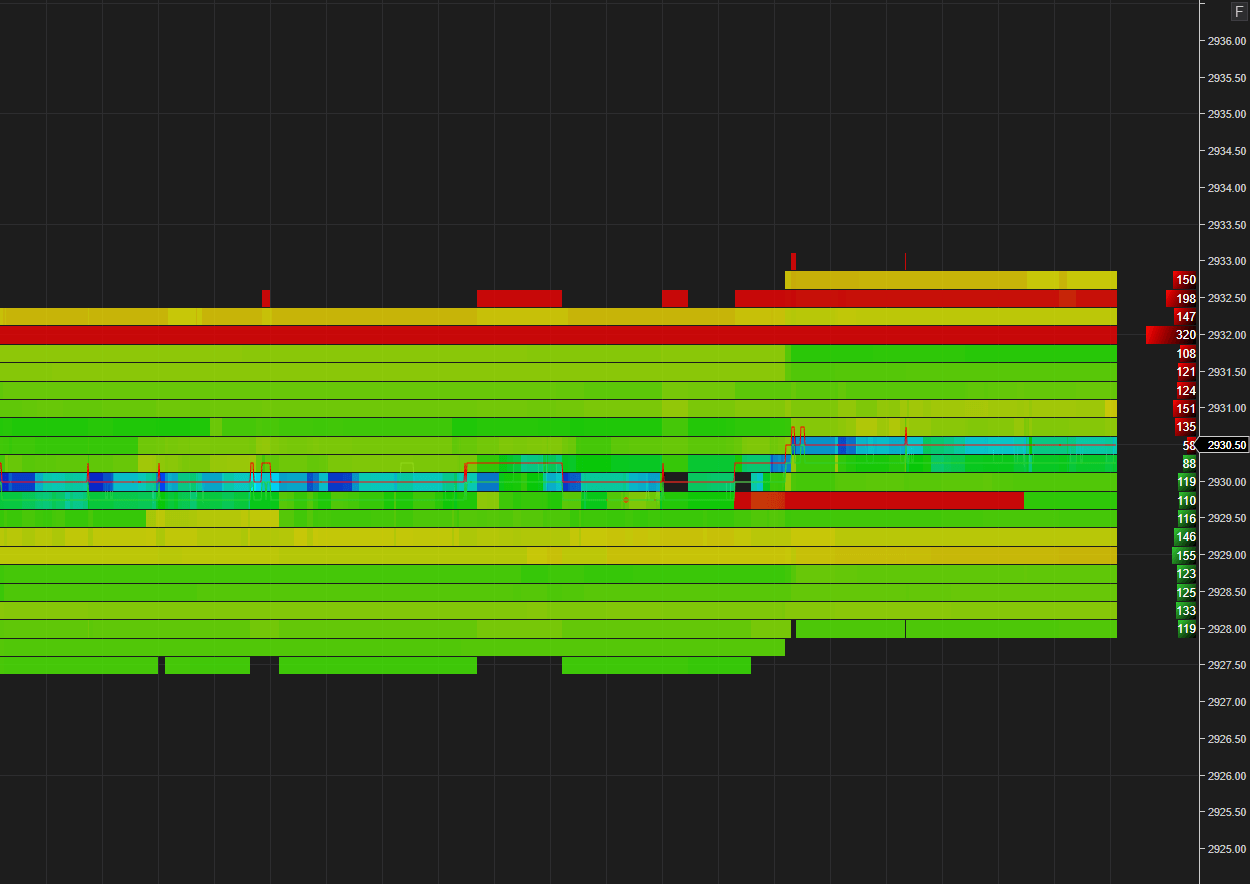
We can see where values above 200 where presented and removed.
Session Mode
– Allows you to have the information of the session as a reference. This applies to both the Executed Orders and Limit Orders features. This way you can see within the latest what was the largest limit order and what was the biggest executed order. This provides session context.Example of Session Mode using the Heatmap mode.
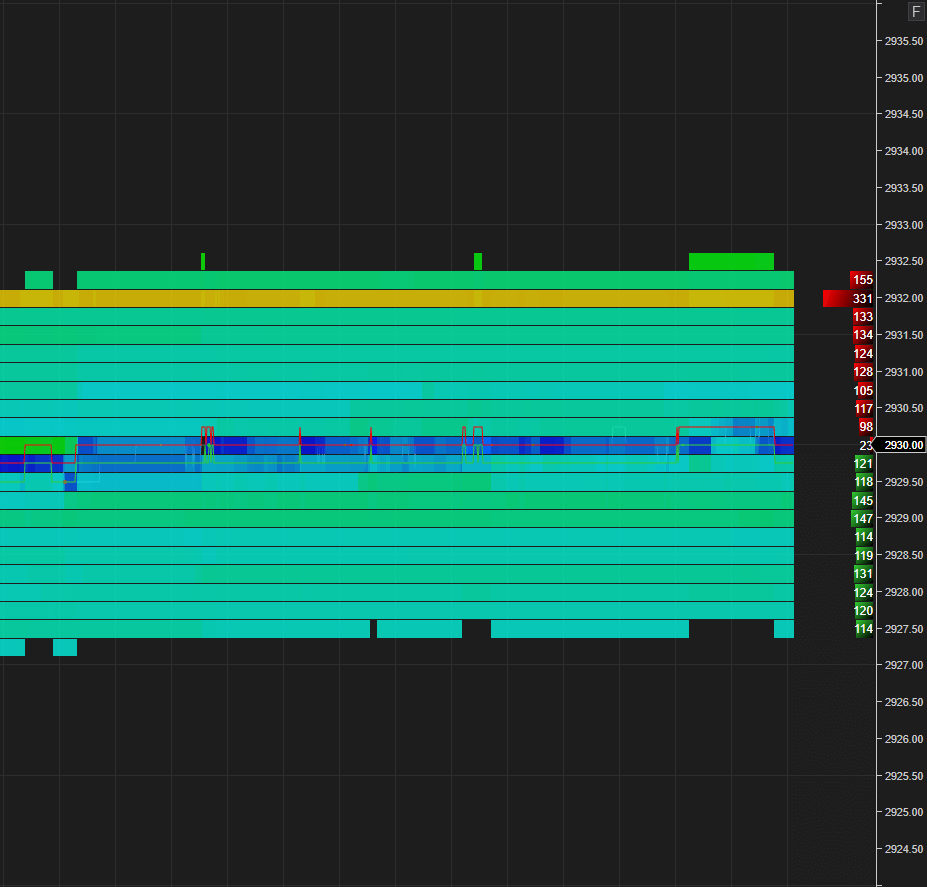
We can see the gradients relative to the maximum volume seen during the current session.
Chart Mode
– With Chart Mode selected you set the range of information that you want to make relative. You can make the Limit Order Visualizer relative to the chart range you determine. This allows you to inspect certain moments in time with more detail. Its like slicing your chart into periods and see the limit orders and executed trades from that slice relative to each other.Example of Chart Mode using the Heatmap mode.
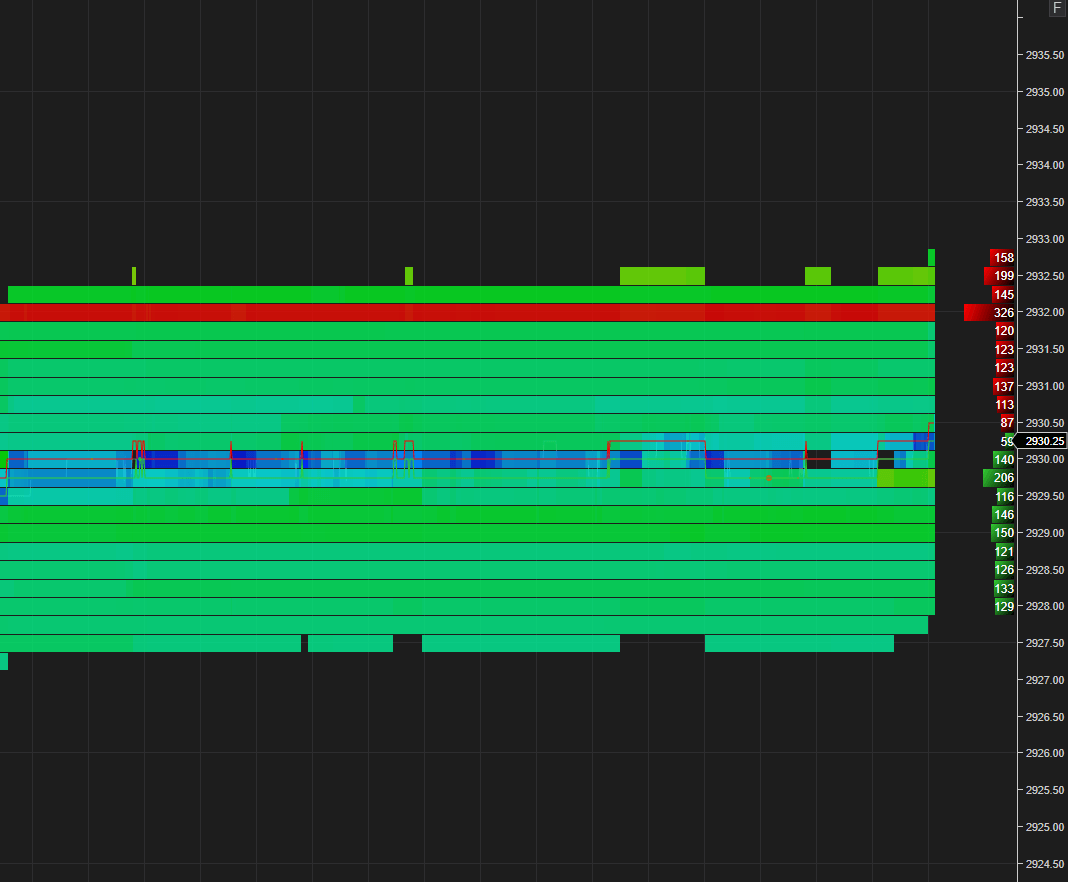
We can see the gradients relative to the volume seen in the viewport.